
Overview
Annually, the faculty of each undergraduate major, standalone minor, and required General Education courses examine student achievement of at least one intended learning outcome for their degree program. Through this work, the faculty confirm students are developing the skills and knowledge expected of a graduate in their discipline.
For the academic year 2017-18, this page provides a summary of
- students’ self-perceptions of their knowledge and abilities,
- the faculty’s conclusions about student learning achievement in undergraduate majors, standalone minors,and required General Education courses,
- actions identified to improve student learning, and
- budget implications for proposed improvements to student learning
Links to the intended learning outcomes for each degree are available here. An overview of the annual assessment process is available here. Undergraduate retention and graduation rates are available here.
Please address questions to Laura Martin.
Student Perceptions of their Learning
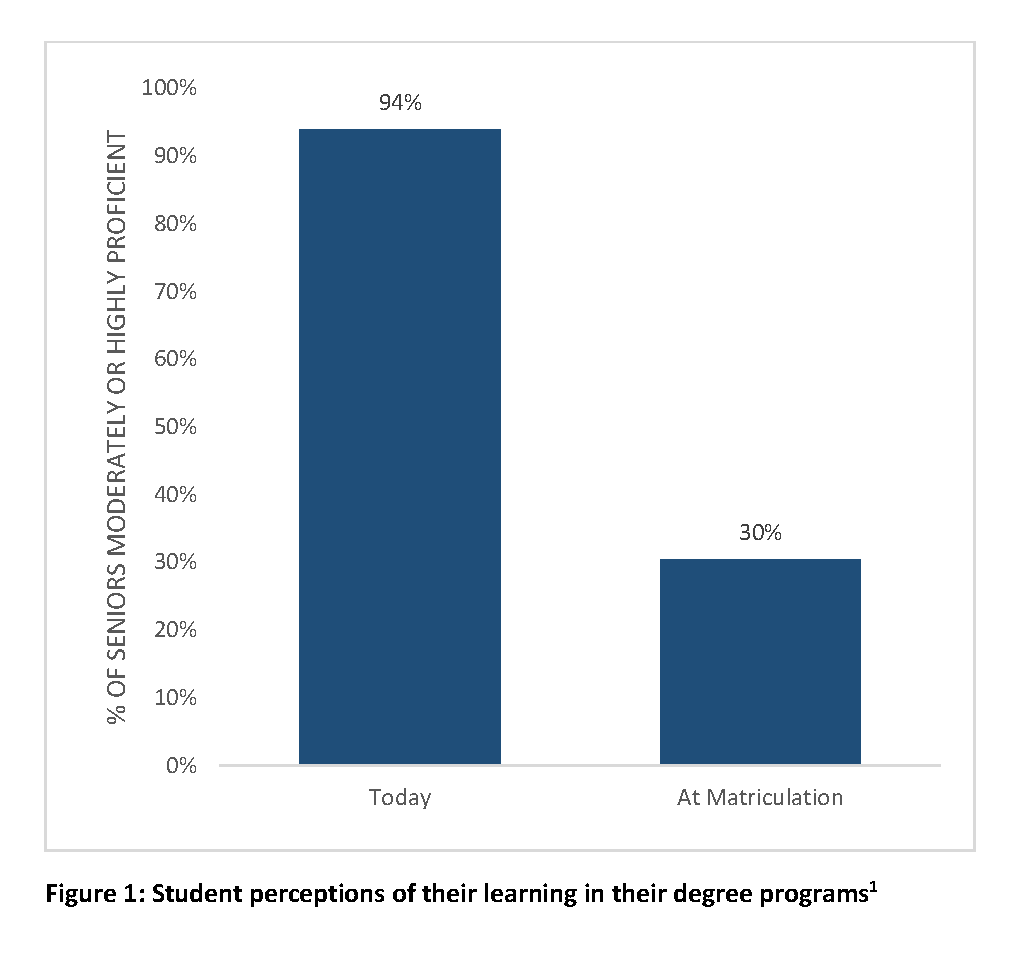
Across all majors, a large majority of seniors1 reported being highly or moderately proficient at the skills and knowledge expected of a graduate from their major or minor (Figure 1). These results are nearly identical for to those for 2013-14, 2014-15, 2015-16, and 2016-17.
These seniors also perceived growth in their knowledge and abilities while at UCM. Only three out of 10 reporting seniors (30%) recalled having high or moderate levels of proficiency in skills and knowledge particular to their major or minor at matriculation.
Seniors also reported substantial growth2 in a core set of skills and knowledge expected of a bachelor’s degree recipient (Figure 2). Global ratings, like this, likely reflect the entire educational experience, including the major, General Education, and extra-curricular activities.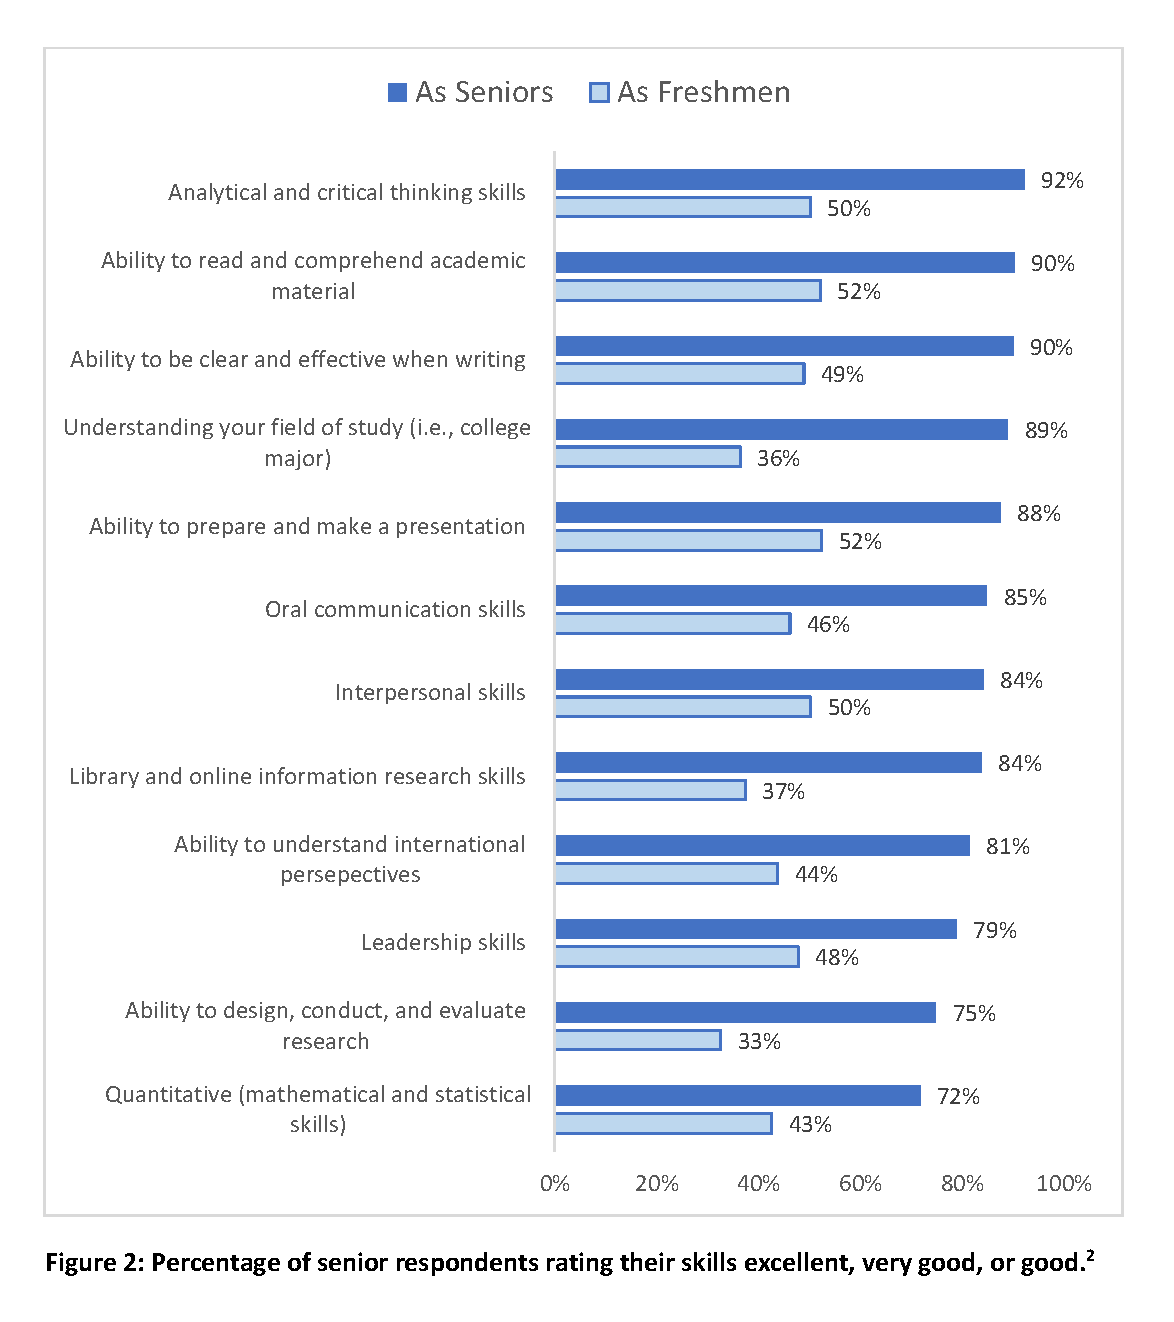
Faculty Perceptions of Student Learning
Slightly less than four in every five undergraduate programs (76%) were pleased with the skills and knowledge demonstrated by students in relation to the intended learning outcomes (Figure 3).3 This indicates that, on the whole, students were achieving program benchmarks or were otherwise meeting or exceeding the faculty's performance 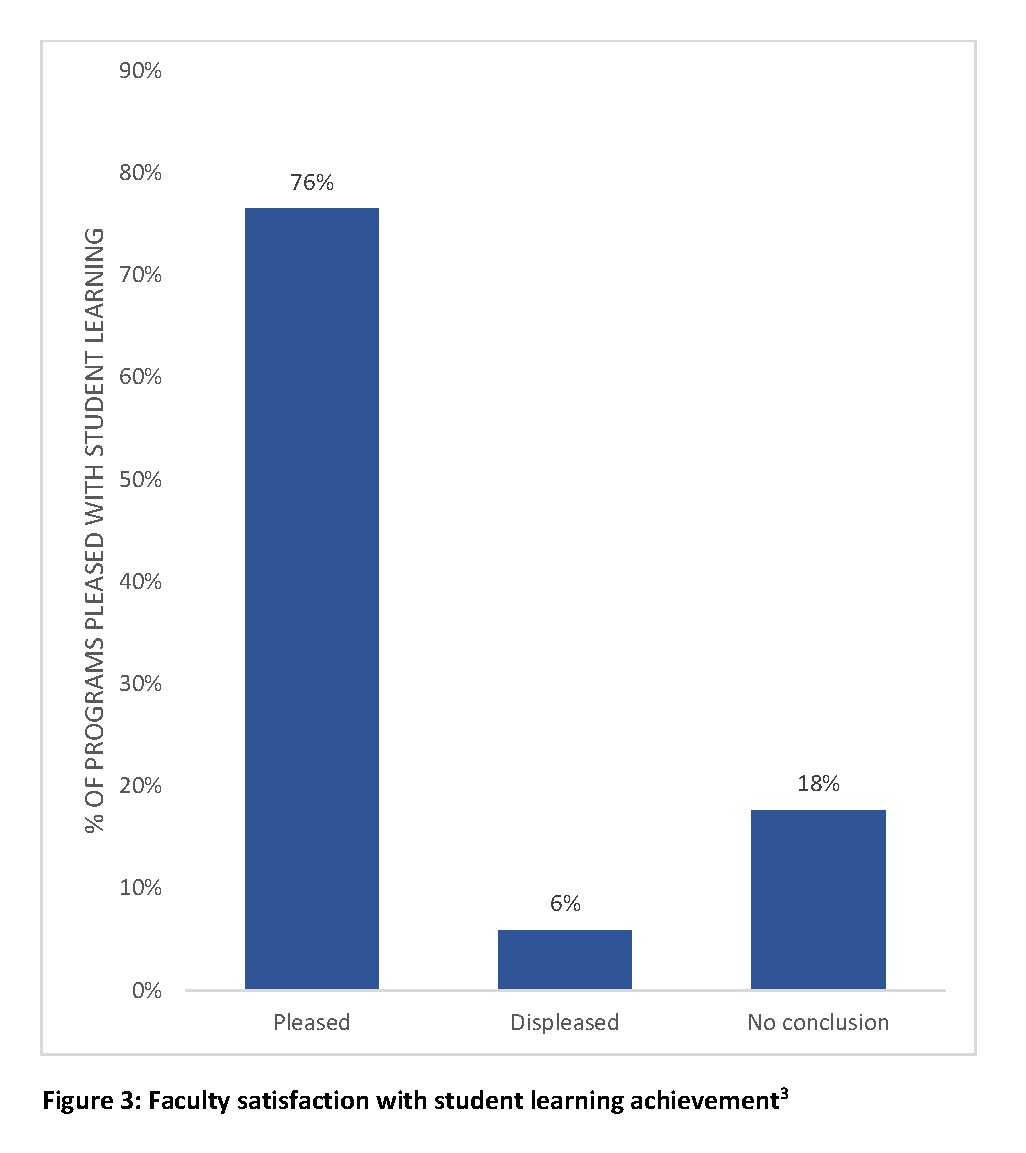 expectations.
In drawing these conclusions, faculty examined diverse types of student work. These included research proposals, lab reports, essays, oral presentations, final exam questions, homework assignments, and capstone design projects.
The percentage of programs reporting being pleased with student learning this year (76%) is slightly lower than previous years (88%, 83%, 78%, 81% for 2013-14, 2014-15, 2015-16, and 2016-17 respectively). This reflects an increase in the percentage of programs declining to draw a conclusion about student learning rather than an increase in the percentage of programs displeased with student work over prior years. Overall, the numbers reflect both positive evidence of student learning in a strong majority of programs over the past four years and, for the handful of programs that are either unsatisfied with current levels of student achievement on a particular learning outcome (6% in 2017-18) or unable to draw meaningful conclusions based on their assessment results (18% in 2017-18), candid engagement in improvement-oriented inquiry. The orientation towards improvement is also evident in the high percentages of reports in 2017-18 that identify strategies for improving student learning (88%, which includes programs that are pleased and programs that are not pleased with current levels of student achievement) or assessment methods (53%).
Faculty Actions to Improve Student Learning
While the majority of programs (76%) were pleased with student performance, 88% responded to assessment results by identifying actions to support continued improvement in student learning.
Example actions included increasing the frequency with which students practice important intellectual skills throughout the curriculum, aligning lower division and upper division courses, rethinking introductory courses, defining preferred sequences for students to complete coursework, and matching class size to pedagogy.
Budget Implications of Actions to Improve Student Learning
Of those programs identifying actions to improve student learning, 24% identified changes that require resources in addition to time from existing faculty. These resources include faculty lines for senate teaching professors, faculty with specific skills required to deliver recommended courses, and an administrative coordinator to support community research opportunities for students.
24% of programs explicitly cited continued support of professional teaching, learning, and assessment staff as important to future work.
Faculty Commitment to Examing Student Learning in Majors, Minors, and General Education
UC Merced faculty demonstrated commitment to systematically examining the effectiveness of their degree programs in cultivating intended student learning. In 2017-18,
- 82% of majors,
- and 100% of standalone minors
submitted a report describing their efforts to assess student achievement of intended learning outcomes. No reports were submitted in 2017-18 for the general education program, which is being redesigned following its academic program review.
Student Achievement: Graduation and Retention Rates
For information on undergraduate retention and graduation rates, visit irds.ucmerced.edu/student-data
1Data from the 2018 Graduating Senior Survey. Values are averages across all students. For each learning outcome for their major, graduating seniors rated themselves as highly proficient, moderately proficient, barely proficient, or not proficient for two time points: the time they took the survey (Today) and, retrospectively, when they started at UCM (When started at UCM).
2 Data from the Spring 2018 University of California Undergraduate Experience Survey (UCUES). For each skill responding seniors rated their abilities as excellent, very good, good, fair or poor for two time points: as seniors and when they started UC Merced as freshmen.
3 As represented in the annual learning outcome report submitted by each program, including major, standalone minor, and required General Education courses (n=17). For each report, faculty conclusions regarding student learning outcomes were aligned to a Likert scale of very pleased, pleased, somewhat pleased, somewhat displeased, displeased, very displeased. In Figure 3 specifically, “Pleased” includes scores of very pleased, pleased, and somewhat pleased.
